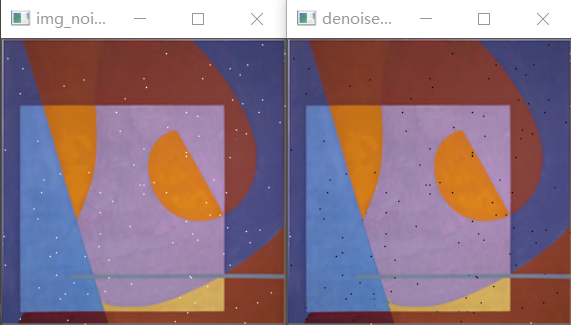
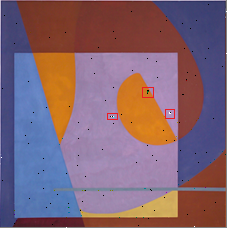
素材

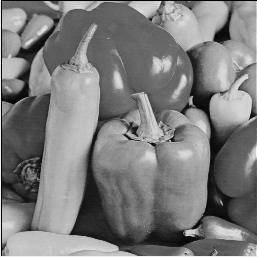
原图:https://gitee.com/icvuln/server_backup_denoise18/blob/master/rsc/03.png

image-20230108200947631

k = 3分为9张子图

详见:https://gitee.com/icvuln/server_backup_denoise18/blob/master/one2k.py

1
2
3
4
5
6
7
8
9
10
11
12
13
14
15
16
17
18
19
20
21
22
23
24
25
import cv2 as cv
import numpy as np

def separate(img, k):
row, col = img.shape
kimg = np.zeros((k, k, row//k, col//k), dtype=int)
for i in range(0, row, k):
for j in range(0, col, k):
for m in range(k):
for n in range(k):
if i//k < row//k and j//k < col//k:
kimg[m][n][i//k][j//k] = img[i + m][j + n]

for i in range(k):
for j in range(k):
cv.imwrite('out/one2k/k3/%d%d.png' % (i, j), kimg[i][j])

def main():
img_dir = 'rsc/03.png'
k = 3
img = cv.imread(img_dir, 0)
separate(img, k)

if __name__ == '__main__':
main()

结果:https://gitee.com/icvuln/server_backup_denoise18/tree/master/out/one2k/k3

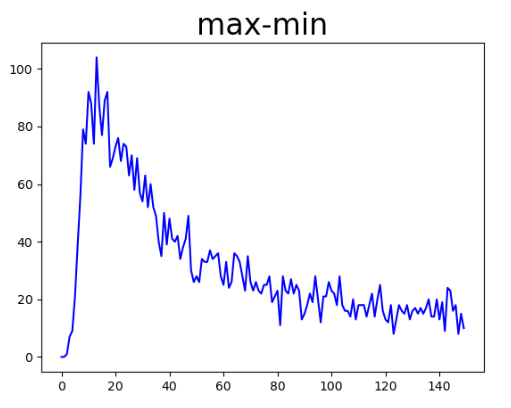
分别求max-min

1
2
3
4
5
6
7
8
9
10
11
12
13
14
15
16
17
18
19
20
21
22
23
24
25
26
27
28
29
30
31
32
import max_sub_min as msm
import os
import cv2 as cv
import denoise18 as dn
import matplotlib.pyplot as plt


def get_img_addrs(root_addr):
img_addrs = os.listdir(root_addr)
return img_addrs

if __name__ == '__main__':
img_dir = 'out/one2k/k3'
img_addrs = get_img_addrs(img_dir)
for img_addr in img_addrs:
img_addr_path = os.path.join(img_dir, img_addr)
if os.path.isdir(img_addr_path):
break
print(img_addr_path)
img = cv.imread(img_addr_path, 0)
differ = dn.get_dif(img)

max_min_differ = msm.get_max_min(differ)

cnt = msm.get_cnt(max_min_differ, 150)

plt.plot(cnt, color='blue')
plt.rcParams['axes.unicode_minus'] = False
plt.title('max-min', fontsize=24, color='black')
plt.savefig(os.path.join('out/one2k/k3/max_sub_min', img_addr))
plt.show()

1
2
3
4
5
6
7
8
9
10
11
12
13
14
15
16
17
18
19
20
21
22
23
24
25
26
27
28
29
30
31
32
33
34
35
36
37
38
39
40
41
import cv2 as cv
import numpy as np
import matplotlib.pyplot as plt

import denoise18 as dn

def get_max_min(differ):
row, col, _ = differ.shape
max_min = np.zeros((row, col), dtype=int)
for i in range(row):
for j in range(col):
max_min[i][j] = max(differ[i][j]) - min(differ[i][j])
return max_min

def get_cnt(array, len):
cnt = np.zeros(len, dtype=int)
row, col = array.shape
for i in range(row):
for j in range(col):
if array[i][j] < len:
cnt[array[i][j]] += 1
return cnt

def main():
img_addr = 'out/03.png'
img = cv.imread(img_addr, 0)
differ = dn.get_dif(img)

max_min_differ = get_max_min(differ)

cnt = get_cnt(max_min_differ, 150)

plt.plot(cnt, color='blue')
# plt.rcParams['font.sans-serif'] = ['SimHei']
plt.rcParams['axes.unicode_minus'] = False
plt.title('max-min', fontsize=24, color='black')
plt.savefig('out/max-min.png')
plt.show()

if __name__ == '__main__':
main()
1
2
3
4
5
6
7
8
9
10
11
12
13
14
15
16
17
18
19
20
21
22
23
24
25
26
27
28
29
30
31
32
33
34
35
36
37
38
39
40
41
42
43
44
45
46
47
48
49
50
51
52
53
54
55
56
57
58
59
60
61
62
63
64
65
66
67
68
69
70
71
72
73
74
75
76
77
78
79
80
81
82
83
84
85
86
87
88
89
90
91
92
93
94
95
96
97
98
99
100
101
102
103
104
105
106
107
108
109
110
# python3.6
# utf-8
# LF

import cv2 as cv
import numpy as np
import matplotlib.pyplot as plt
import pandas as pd
from mpl_toolkits.mplot3d import Axes3D

import show_3d

def get_1D_2_2D(x):
d = {0:[-1, -1], 1:[-1, 0], 2:[-1, 1], 3:[0, 1], 4:[1, 1], 5:[1, 0], 6:[1, -1], 7:[0, -1]}
return d[x]

def get_dif(img):
raw, col = img.shape
dif = np.zeros((raw - 1, col - 1, 8), dtype=int)

for i in range(raw - 1):
for j in range(col - 1):
for m in range(8):
d = get_1D_2_2D(m)
if(i + d[0] >= 0 and i + d[0] + 1 <= raw - 1 and j + d[1] >= 0 and j + d[1] + 1 <= col -1):
dif[i][j][m] = abs(int(img[i][j]) - int(img[i + d[0]][j + d[1]])) + \
abs(int(img[i][j + 1]) - int(img[i + d[0]][j + d[1] + 1])) + \
abs(int(img[i + 1][j + 1]) - int(img[i + d[0] + 1][j + d[1] + 1])) + \
abs(int(img[i + 1][j]) - int(img[i + d[0] + 1][j + d[1]]))
return dif

def drew_graph(array, flag):
cnt = np.zeros(100)
raw, col, _ = array.shape
for i in range(raw):
for j in range(col):
d = sorted(array[i][j])
# print(d)
if int(d[flag]) < 100:
cnt[int(d[flag])] += 1

plt.plot(cnt, color='red')
# plt.rcParams['font.sans-serif'] = ['SimHei']
plt.rcParams['axes.unicode_minus'] = False
plt.title('max', fontsize=24, color='black')
plt.savefig('fenbu.png')
plt.show()

def get_show(ary):
raw, col, _ = ary.shape
imin = np.zeros((raw, col))
for i in range(raw):
for j in range(col):
d = sorted(ary[i][j])
if d[0] <= 20:
imin[i][j] = 255
cv.imwrite('min.png', imin)

imax = np.zeros((raw, col))
for i in range(raw):
for j in range(col):
d = sorted(ary[i][j])
if d[7] > 60:
imax[i][j] = 255
cv.imwrite('max.png', imax)

def get_3d(ary):
raw, col, _ = ary.shape
minmax = 0
for i in range(raw):
for j in range(col):
d = sorted(ary[i][j])
if d[0] > minmax:
minmax = d[0]

maxmax = 0
for i in range(raw):
for j in range(col):
d = sorted(ary[i][j])
if d[7] > maxmax:
maxmax = d[7]

data = np.zeros((int(minmax) + 1, int(maxmax) + 1))
for i in range(raw):
for j in range(col):
d = sorted(ary[i][j])
data[int(d[0])][int(d[7])] += 1

np.savetxt('data.csv', data, delimiter=',')
'''
fig = plt.figure()
ax = fig.add_subplot(111, projection='3d')
for i in range(int(minmax) + 1):
for j in range(int(maxmax) + 1):
ax.scatter(i, j, data[i][j], marker='o')
plt.savefig('3d.png')
plt.show()
'''

def main(imgdir):
img = cv.imread(imgdir, 0)
differ = get_dif(img)
# drew_graph(differ, 7)
# get_show(differ)
get_3d(differ)


if __name__ == '__main__':
img_dir = '03.png'
main(img_dir)

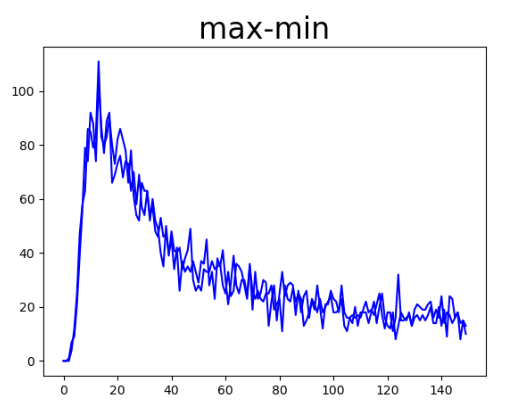
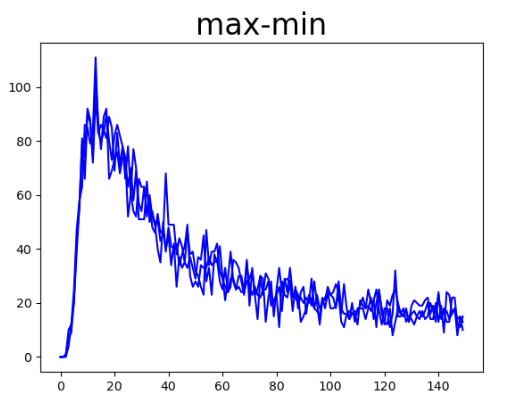
部分结果如下:

image-20230108201337769

image-20230108201401295

image-20230108201419538

所有结果:https://gitee.com/icvuln/server_backup_denoise18/tree/master/out/one2k/k3/max_sub_min